
More than 7,000 satellites have been launched into Earth orbit since Sputnik. However they stop functioning once they are out of fuel or one of their systems fail; only around 1,400 of them are currently in orbit and operational. During the early days of the space age, it was not considered what would happen to the satellites once they become non-operational. No measures were implemented to retrieve or dispose of them. This resulted in an unnecessary accumulation of retired spacecraft in Earth orbits. It is not only the satellites that contribute to the increase in orbital density, but also the upper stage engines, which carry the satellites to orbit, fragments from engine exhausts and many other human-made objects.
Today, the space community is aware of this orbital debris and the problems it causes. A worldwide system of ground-based radars, telescopes, along with space-based sensors is utilized for tracking and cataloging orbital objects. Conjunction warnings are provided to space operators in order for them to execute collision avoidance maneuvers. Before a launch vehicle lifts off, its trajectory is checked against the trajectories of orbital objects to avoid any collisions. There are forecasts which take into account the historical launch trends and aim to estimate the number of satellite and rocket bodies that will accummulate in the orbits in the future.
However, the satellite industry is likely to grow with more and more start-up companies having been established around the globe and historical trends are no more representative. Furthermore, majority of the state-of-the-art forecasts do not take into account the orbital parameters which are critical for the accuracy of an orbital debris simulation. In this scope, our study aims to examine the impact of new trends in satellite launch activities on the orbital debris environment and collision risk. As a foundation, we developed a deployment scenario for satellites and associated rocket bodies based on publicly announced future missions. The upcoming orbital injection technologies, such as the new launch vehicles dedicated for small spacecraft and propulsive interstages, are also considered in this scenario. We then used a simulation tool developed in-house to propagate the objects within this long-term scenario using variable-sized time-steps as small as one second to detect conjunctions between objects.
Satellite Launches
Since the 1960s, the annual number of payloads launched into Earth orbit was around 100-150 without large deviations. Figure 1 represents this using the data from SpaceTrack database. The blue lines in the graph represent the number of payloads injected into Low Earth Orbit, LEO, (i.e. below 2000 km apogee) in the respective year and the red lines indicate the payloads located at higher altitudes. Due to the past stability of injection rates, most of the state-of-the-art long-term orbital debris projections record the launch activities 8- or 10-years before the start of their simulation and repeat that launch cycle consecutively for the entire simulation period.
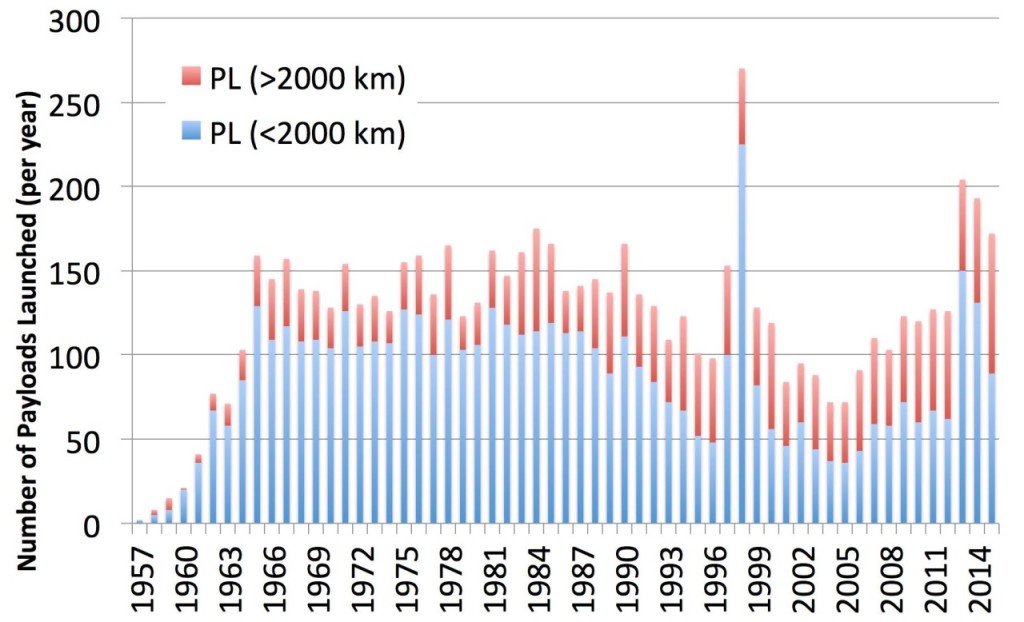
Figure 1 – Number of Payloads Injected into Orbit
In recent years, the satellite market has been undergoing a major evolution with new space companies replacing the traditional approach of deploying a few large, complex and costly satellites with a multitude of smaller, less complex and cheaper satellites. This new approach creates a sharp increase in the number of launched satellites and so the historic trends are no longer representative. The early effects of this change can already be observed in the right-most three bars of Figure 1 representing the years 2013, 2014 and 2015. However, according to our research, the actual boom in small satellite market is likely to happen in the upcoming years.
The only way to make more realistic future predictions in such an emergent, thus unstable, environment is to put together the numbers from an up-to-date market analysis and try to estimate the trend. Since the orbital debris is more of a critical problem in LEO compared to higher altitudes, and since the recent changes in the satellite market s predominantly related with LEO missions, our study is dedicated to develop a scenario for LEO injections.
To develop this scenario, we systematically gather available data on future launches and collect it in a database. We aim to build a database that covers all the publicly available launch related information regarding the companies which intend to launch satellites into LEO between 2016-2030. These companies and/or constellations include, but are not limited to: Blacksky, CICERO, EROS, Landmapper, Leosat, Northstar, O3b, OmniEarth, OneWeb, OuterNet, PlanetIQ, Planet Labs, Radarsat, Terra Bella (formerly Skybox), SpaceX and Spire.
Data is gathered either through direct contact with the company or from online resources (i.e. company press releases and published interviews). Collected data includes: statements on the number of launches for each year between 2016-2030; the target orbits the constellation will be distributed to; and spacecraft mass and area. Whenever data are not available, estimations are made considering the constellation’s purpose and company’s previous missions, if any. The database also takes into account possible newcomers into commercial Earth observation and telecommunication markets (as additions), as well as the replenishment launches (as extrapolations) of the current and upcoming constellations to keep them operational. We are aware that it is unlikely that all of these companies will survive, however our model assumes a thriving “New Space” economy which would be a worst-case debris scenario.
Table 1 – Constellation Launch Data (2016-2020)
(values indicated as “u” refer to satellites in the respective CubeSat form factor;
underlined values are our own estimates)
| Constellation | Apogee (km) |
Perigee (km) |
Incl. (deg) |
Mass (kg) | Area (m2) | 2016 | 2017 | 2018 | 2019 | 2020 |
| Commercial Remote Sensing & Weather Tracking | ||||||||||
| Landmapper-BC (Astro Digital) | 600 | 600 | SSO | 6u | 6u | 2 | 4 | 4 | ||
| Landmapper-HD (Astro Digital) | SSO | 16u | 16u | 2 | 6 | 6 | 6 | |||
| GRUS (Axelspace) | 675 | 675 | SSO | 80 | 0.4 | 3 | 10 | 10 | 10 | |
| BlackSky Global | 450 | 450 | 40-55 | 50 | 0.8 | 6 | 18 | 18 | 18 | |
| World View (Digital Globe) | 620 | 620 | 98 | 2800 | 2.5 | 1 | ||||
| Digital Globe & Taqnia Space | 3 | 3 | ||||||||
| CICERO (GeoOptics) | 650 | 650 | SSO | 104 | 1 | 6 | 6 | 12 | 4 | 4 |
| HOPSat (Hera Systems) | SSO | 12u | 12u | 9 | 10 | 10 | 10 | 9 | ||
| HyspecIQ | 500 | 500 | SSO | 600 | 1.4 | 2 | ||||
| EROS (ImageSat) | 500 | 500 | SSO | 350 | 1 | 1 | 1 | |||
| Radarsat Costellation Mission (MDA) | 592.7 | 592.7 | SSO | 1400 | 2 | 3 | ||||
| NorthStar (NorStar Space Data Inc.) | SSO | 750 | 0.15 | 10 | 10 | 10 | ||||
| OmniEarth | 680 | 680 | 98 | 100 | 0.5 | 18 | ||||
| PlanetIQ | 800 | 800 | 72 | 25 | 0.01 | 2 | 10 | 6 | 6 | |
| Planet Labs | 400 | 400 | 0 | 3u | 3u | 250 | 75 | 75 | 75 | 75 |
| Satellogic | 500 | 500 | SSO | 35 | 0.18 | 6 | 19 | 50 | 50 | 50 |
| Spire | 550 | 550 | 0 | 50 | 0.03 | 50 | 50 | 50 | 50 | 50 |
| Terra Bella | 600 | 600 | 0 | 120 | 0.4 | 2 | 5 | 5 | 8 | |
| Generation 3 (UrtheCast) | 0 | 100 | 0.5 | 8 | 8 | |||||
| Other Remote Sensing & Weather Sat. | 0 | 40 | 0.15 | 25 | 50 | 80 | ||||
| Commercial Telecom | ||||||||||
| Iridium NEXT | 780 | 780 | 86.4 | 50 | 0.2 | 32 | 40 | |||
| LeoSat | 1430 | 1430 | 0 | 100 | 0.5 | 54 | 54 | |||
| O3b | 8062 | 8062 | 0.1 | 700 | 1.5 | 4 | 4 | 8 | 8 | |
| OneWeb | 1200 | 1200 | 0 | 150 | 0.7 | 320 | 330 | 100 | ||
| OuterNet | 200 | 200 | 0 | 1u | 1u | 10 | 12 | |||
| SpaceX | 1100 | 1100 | 0 | 200 | 0.8 | 300 | 300 | |||
| Other Telecom Satellites | 0 | 100 | 0.5 | 50 | 80 | |||||
| Non-Commercial Satellites | ||||||||||
| All non-commercial | 0 | 1500 | 1.5 | 115 | 125 | 130 | 135 | 140 | ||
| TOTAL: | 493 | 388 | 743 | 1189 | 993 | |||||
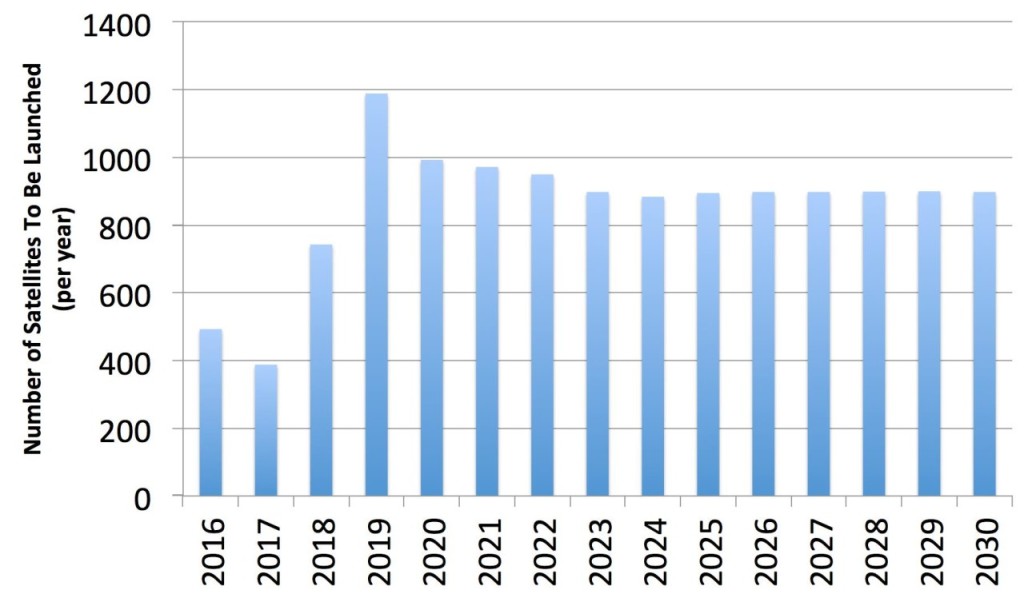
Figure 2 – Scenario for Satellites (2016-2030)
Table 1 shows a summary of our database for the period 2016-2020. Beyond 2020, most of our data has been calculated for replenishment launches, therefore are extrapolations of the first five years. The numbers indicated with underlined italic fonts in Table 1 are our estimations. Figure 2 shows a summary graph generated from the database for the time interval 2016-2030. As seen from, the main drivers of the sharp increase are the constellations for telecommunication (i.e. OneWeb and SpaceX). If the installations of these constellations are carried on as announced, these two alone will provide half of the annual launches starting from 2018.
Rocket Bodies
Figure 3 shows the SpaceTrack data for the annually cataloged rocket bodies. This graph illustrates the number of rocket bodies injected into orbit per year peaked in 1980s and decreased once satellites became smaller and shared launches popularized, stabilizing around 75 rocket body/year for the last 15 years. Around half of these bodies were positioned at LEO altitudes.
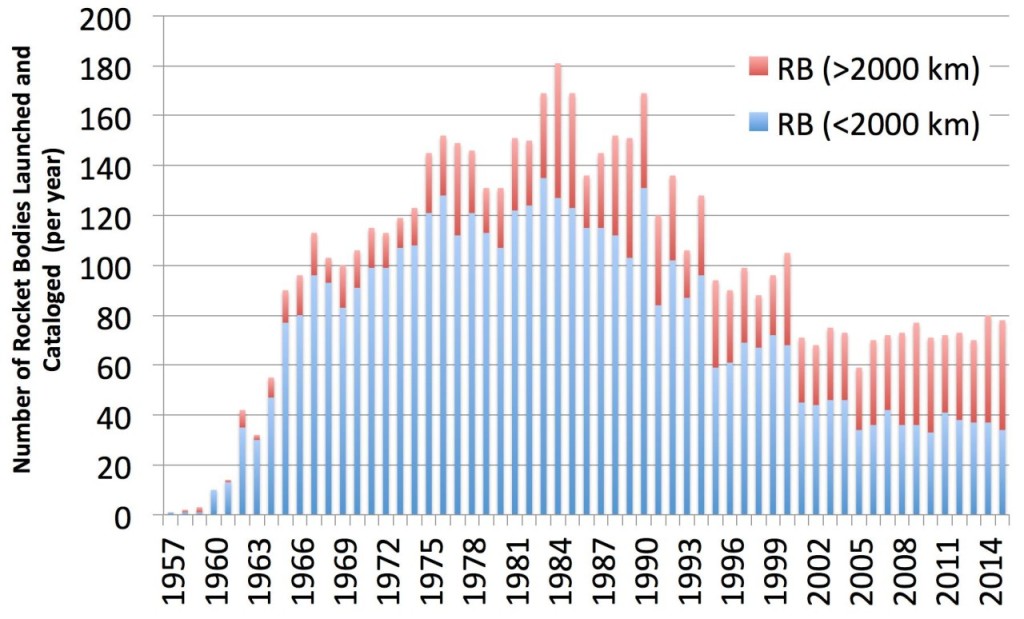
Figure 3 – Number of Rocket Bodies Injected into Orbit and Cataloged
As a cross-check, Table 2 shows the number of LEO launches for the last five years. Roughly half of the R-7 launches indicated in the table were missions that carried crew and cargo to the International Space Station. It is worth mentioning that the numbers given per year in Figure 3 are not identical to the number of launches in that specific year in Table 2. This is due to the fact that for some of the launches, there are multiple upper stages remaining in orbit. Conversely, in some missions, the rocket bodies re-enter the atmosphere immediately after the deployment of their payloads; such objects may not be included in the SpaceTrack catalog.
Table 2 – Number of Successful Launches (LEO only)
| Launch Vehicle | 2011 | 2012 | 2013 | 2014 | 2015 |
| R-7 (Soyuz/Molniya) | 12 | 12 | 13 | 15 | 11 |
| Long March) | 9 | 10 | 10 | 13 | 10 |
| Atlas 5 | 2 | 2 | 2 | 2 | 3 |
| Ariane 5 | 1 | 1 | 1 | 1 | 0 |
| Falcon 9 | 0 | 1 | 2 | 3 | 3 |
| Delta 2 | 2 | 0 | 0 | 1 | 1 |
| Delta 4 | 1 | 1 | 1 | 1 | 0 |
| H-2A | 2 | 1 | 1 | 2 | 2 |
| H-2B | 1 | 1 | 1 | 0 | 1 |
| PSLV | 2 | 2 | 1 | 1 | 3 |
| Antares | 0 | 0 | 2 | 2 | 0 |
| Dnepr | 1 | 0 | 2 | 2 | 1 |
| Rokot | 0 | 1 | 4 | 2 | 2 |
| Vega | 0 | 1 | 1 | 1 | 2 |
| Strela | 0 | 0 | 1 | 1 | 0 |
| Kuaizhou | 0 | 0 | 1 | 1 | 0 |
| Minotaur 1 | 2 | 0 | 1 | 0 | 0 |
| Uhna | 0 | 1 | 0 | 0 | 0 |
| Safir | 1 | 1 | 0 | 0 | 1 |
| Pegasus XL | 0 | 1 | 1 | 0 | 0 |
| Shavit | 0 | 0 | 0 | 1 | 0 |
| Epsilon | 0 | 0 | 1 | 0 | 0 |
| Angara | 0 | 0 | 1 | 0 | 0 |
| Zenit | 1 | 0 | 0 | 0 | 0 |
| Sum | 37 | 36 | 47 | 49 | 40 |
Considering the data, it is reasonable to estimate that typically 40 rocket bodies have been injected into LEO every year since 2005. However, our analysis on the SpaceTrack catalog shows that some portion of these rocket bodies decays within a couple of days after their launch date and it is not meaningful to consider those in our long-term debris simulations. To find out this ratio, we divide the catalog into six 10-year periods and perform a histogram analysis within these blocks. Table 3 shows that, historically, 25% to 40% of the rocket bodies injected into orbit re-entered the atmosphere within 10 days. This temporal analysis reveals another interesting result: for the last 50 years, a shrinking percentage of the rocket bodies decayed soon after their launch and hence contributed more to the orbital debris problem. However, with the expectation of stricter rules and a potential use of reusable launchers, we build our scenario around an assumption that 30% of the rocket bodies will be de-orbited in the future and 70% will be left for their natural decay.
Table 3 – Percentage of rocket bodies decayed in 10 days after their launch date, per decade
| 1957-1966 | 1967-1976 | 1977-1986 | 1987-1996 | 1997-2006 | 2007-2006 | |
| # of RB deorbited in 10 days | 94 | 417 | 495 | 357 | 154 | 110 |
| Total # of RB cataloged | 315 | 1062 | 1267 | 1012 | 583 | 445 |
| Ratio of RB deorbited in 10 days | 30% | 39% | 39% | 35% | 26% | 25% |
Having all these historical data, it remains difficult to estimate future trends for the number of rocket body deployments into orbit. Since the satellites are getting smaller in size and weight, more of them fit into a launch vehicle. Therefore, the boom in the small satellite market is unlikely to trigger a sharp increase in demand on the launch sector.
Conversely, there is a widespread effort to enhance orbital injection capabilities and accuracy. A long list of companies such as Microcosm, Rocket Lab, Firefly Space Systems, Sierra Nevada Corporation and Arca Space Corporation are developing new launch vehicles dedicated for small satellites. There are other companies which intend to develop interstages with propulsive capabilities, which will allow the deployment of satellites into their desired orbits beyond the restrictions of the launch vehicle used.
Considering these aspects as a whole, we decided to correlate the rocket body deployment scenario with our satellite deployment scenario. For this purpose, we analyze rideshare missions (i.e. missions containing at least one secondary payload with the primary payload) performed in the last 15 years to find out how many payloads were aboard in each of those launches. Table 4 lists the main launch vehicles used in these missions.
Table 4 – Average Number of Satellites Launched During Shared Missions
| Launch Vehicle | Number of Secondary Payloads Launched | Number of Launches | Average Number of Payloads Launched per Shared Mission |
| Dnepr | 122 | 12 | 10.2 |
| PSLV | 52 | 15 | 3.5 |
| Atlas V | 46 | 4 | 11.5 |
| Minotaur 1 | 46 | 7 | 6.6 |
| HII-A | 27 | 6 | 4.5 |
| Soyuz-2 | 23 | 5 | 4.6 |
| Long March | 22 | 5 | 4.4 |
| Falcon 9 | 19 | 3 | 6.3 |
| Delta II | 11 | 4 | 2.8 |
| Vega | 11 | 2 | 5.5 |
| TOTAL | 379 | 63 | 6.0 |
As seen from the table, an average of six payloads was carried per mission. However, there had been launch campaigns which carried more than 30 payloads to space. In June 2016, a Falcon 9 rocket is expected to carry 88 satellites utilizing the Sherpa deployer.
Considering these advancements, we find it reasonable to assume that a LEO launch campaign, on average, will carry nine satellites into orbit in the near future. We also assume that only 70% of the rocket bodies will stay in orbit as explained above. Within this framework, Figure 4 shows the scenario for rocket bodies to be included in our debris simulations. The apogee, perigee and inclination data for these objects were estimated in correlation with the information gathered on announced spacecraft launches and the historical trends.
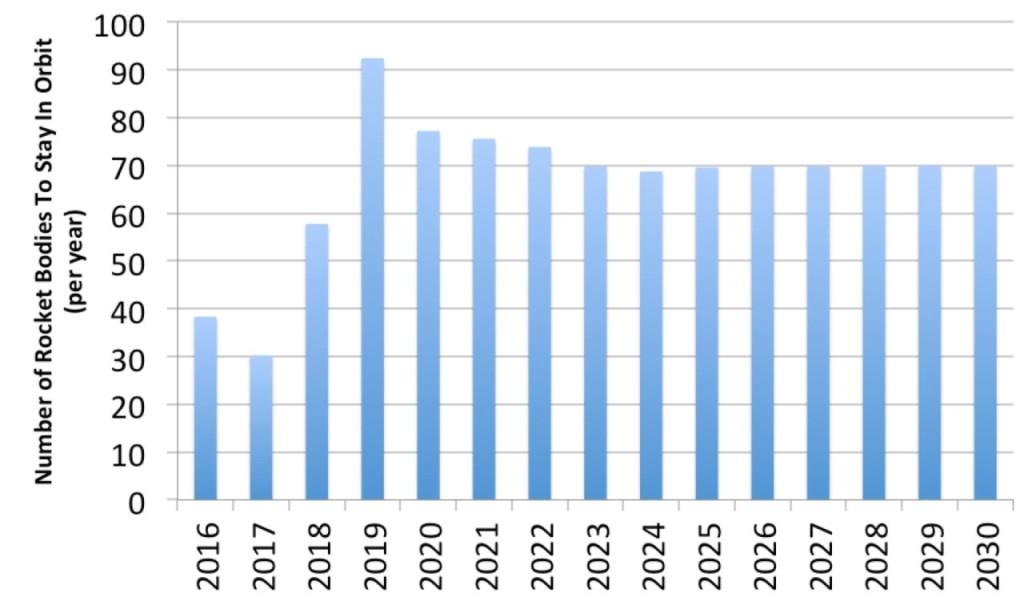
Figure 4 – Scenario for Rocket Bodies to Stay In Orbit (2016-2030)
Results
The developed deployment scenarios feed into our simulation tool that is capable of propagating the objects with variable-sized time-steps as small as one second. An automated script pulls the necessary parameters from the database and converts them into a suitable format to be fed into the simulation. Launch epoch dates were assigned randomly within the launch year for each constellation from the database. A maximum of 15 objects are allowed for a single launch. Additional parameters, i.e. area-to-mass ratios, drag coefficient and reflectivity, are assigned to each object according to their physical specifications.
Figure 5 shows the results of a single simulation run for the number of objects greater than 10 cm in LEO. This run uses an initial population from the SpaceTrack catalogue as of June 2015; additional objects are introduced to the population over time according to our deployment scenarios. Full collision functionality of the code is enabled.
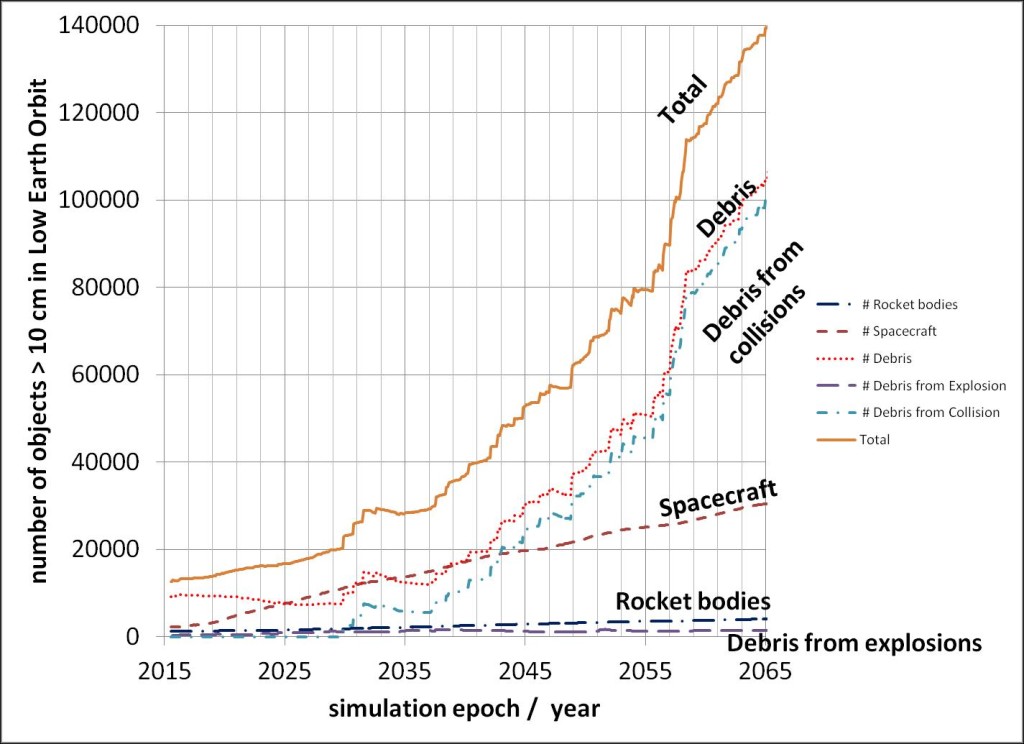
Figure 5 – Number of debris objects in LEO over time for a single simulation run using the deployment scenario.
In this (singular) simulation run, the first collisions occur in the late 2029-2032 timeframe. A portion of that debris decays between 2032 and 2036, but from 2036 collisions start to occur regularly, dominating the increase in object population.
In addition to the number of objects, the tool also tracks conjunctions, which are close encounters between space objects. Figure 6 shows all detected conjunctions with a probability of collision Pc larger than 10-4. In the given scenario, there are only 1126 in 2016, rising to a maximum of 179 thousand in 2062. The pronounced spikes are follow-up conjunctions after breakup events, when objects in a debris cloud are still close to each other. Figure 7 shows only conjunctions involving at least one spacecraft and hence omitting the direct after effects of a breakup event. In this case, the number rises from 415 conjunctions with Pc>10-4 in 2016 to 44 thousand in 2064. The consequence is that operators might be overwhelmed by those numbers and do not perform collision avoidance maneuvers.
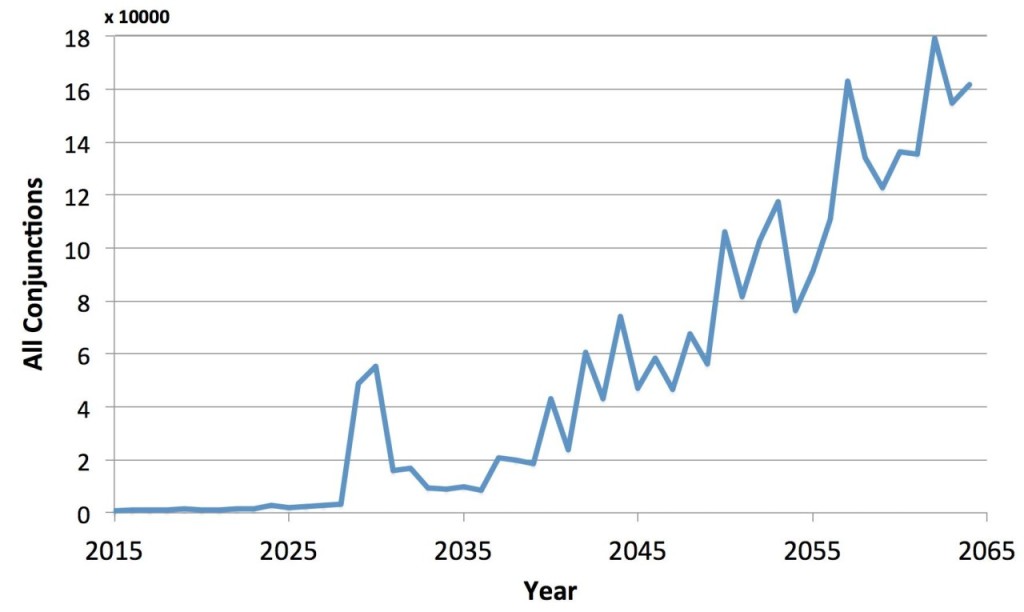
Figure 6 – Number of conjunctions with a probability of collision larger than 10- 4 per year
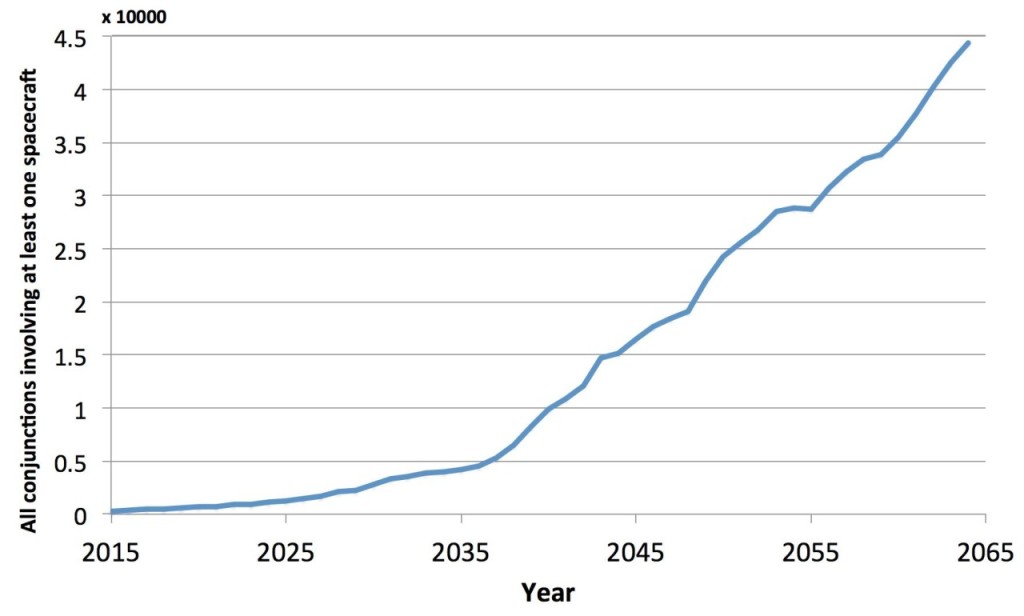
Figure 7 – Number of conjunctions involving at least one spacecraft
Conclusions And Outlook
Examining the simulation results, the total number of objects to accumulate in different orbits can be monitored and the number of conjunctions can be tracked to assess the collision risks. The simulation makes it possible to follow the short- and long-term effects of a particular satellite or constellation in the space environment. Likewise, the effects of changes in the debris environment on a particular satellite or constellation can be evaluated.
We are aware that, while a single run already provides interesting information, it is necessary to obtain error bounds and average projections with a full Monte Carlo treatment. This task is to be implemented in the future.
It is our hope that the results of this study and further utilization of the developed simulation tool will assist in the investigation of more accurate deorbiting metrics to replace the generic 25-year disposal requirement, as well as to guide future launches toward more sustainable and safe orbits..


![A trajectory analysis that used a computational fluid dynamics approach to determine the likely position and velocity histories of the foam (Credits: NASA Ref [1] p61).](http://www.spacesafetymagazine.com/wp-content/uploads/2014/05/fluid-dynamics-trajectory-analysis-50x50.jpg)


Leave a Reply